- January 17, 2026
- Posted by: admin
- Category: BitCoin, Blockchain, Cryptocurrency, Investments

The post Solana (SOL) Price Eyes $150 as Active Addresses Rebound and ETF Volumes Hit $6B appeared first on Coinpedia Fintech News
The Solana (SOL) price is flashing early signs of a reset after months of cooling network activity. New data shows active addresses are ticking higher, hinting at a return of on-chain participation after a long H2 slowdown. At the same time, spot Solana ETF volumes have steadily climbed toward $6 billion, suggesting that institutional involvement is building even without a retail frenzy.
On the chart, it is still trading inside a rising channel, with momentum indicators sitting near neutral—often a setup that precedes a directional move. The big question now is whether buyers can add volume and push the SOL price toward the $150–$152 resistance zone, or whether the rally stalls and retests support near $140.
Solana’s Active Address is Recovering
Throughout 2025, Solana’s active address count has been declining, suggesting a consistent drop in trading activity. With the beginning of 2026, these levels rebounded after remaining almost flat in Q4, 2025. This indicates the trader’s attention has shifted back to the token, hinting at a potential upswing to be on the horizon.
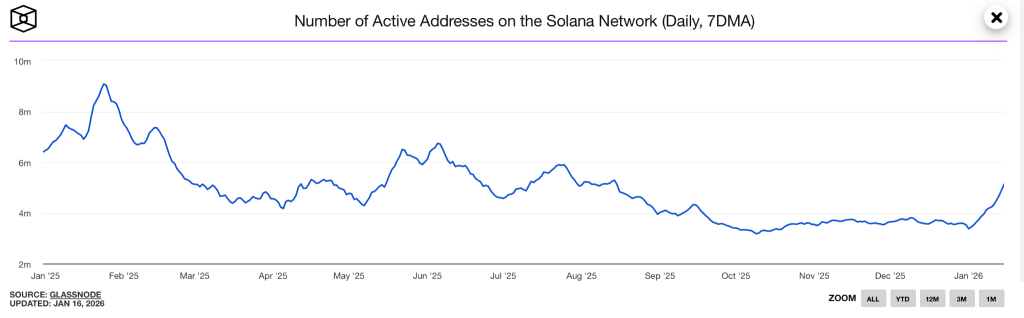
The chart shows a clear rebound from nearly 3.4 million to above 5 million, which is a meaningful shift in direction. This suggests demand is reappearing on-chain, not just on exchanges. With this, SOL price could move from a declining phase to a recovery phase. However, it is still an early signal, not a confirmation of a full network re-acceleration.
Spot ETF Volumes on Solana Reach $6B
The Solana ETF went live in late October 2025, and since then, the flows have remained positive. The cumulative spot ETF volumes have been grinding higher, which is now approaching $6 billion. This indicates a rising institutional participation as SOL stabilised and interest broadened.
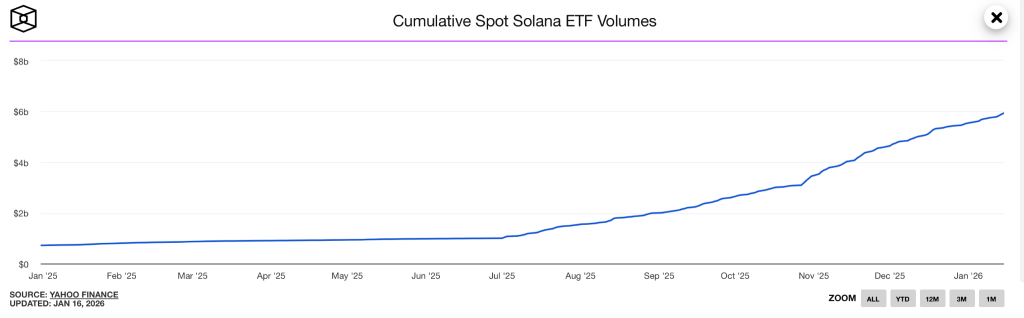
The ETFs create a consistent flow channel for the investors who do not want to use exchanges. A rise in the volumes suggests a repeated engagement but not one-off spikes. Therefore, the increase in ETF data supports a quiet demand narrative, which may further trigger a breakout if the price confirms it.
SOL Price Analysis: Key Levels & Breakout Targets
The long-term price action of Solana could appear stagnant, but the short-term price action shows a strong ascending trend. The price is trading within a rising parallel channel in the 4-hr chart, which keeps the bullish trend in action. The token reclaimed the levels within the channel after a small breakout, which suggests the upswing may prevail for somemore time.
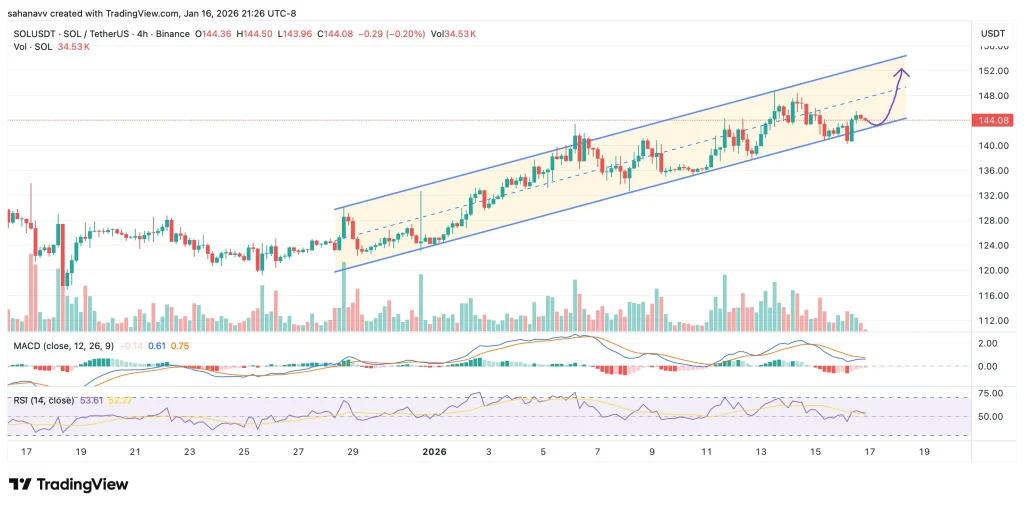
The SOL price is tightening, while the momentum remains mixed. RSI is neutral but has remained within the upper bands. On the other hand, the MACD is flattening but shows a drop in the selling pressure. This is a common sign of a consolidation inside an uptrend rather than a clear reversal.
The first resistance zone to watch now is between $150 and $152, where the levels between $143 and $144 could act as a strong barrier. If the price breaks above $152 with stronger volume, it may open the door for a continued move towards higher targets, probably to $170. On the other hand, a rejection below $140 would weaken the channel structure and shift the setup into a larger pullback.
The Bottom Line
Solana price is setting up for a measured bullish continuation, not a hype-driven spike. On-chain data shows active addresses rebounding, ETF charts point to steady institutional participation, and price is still holding a rising channel while momentum cools in neutral territory.
The trigger is clear: SOL needs a clean break and hold above $150–$152 with volume to confirm the next leg higher. Until then, this remains a bullish-but-patient setup, where a rejection could still pull the price back toward $143 and even $138–$140 without breaking the broader structure.


